Composite pipelines in the energy industry’s infrastructure have brought along with it many advantages, like reducing risk and enhancing pipeline integrity. Although they are less vulnerable, they are not risk adverse, and like their steel counterparts, these pipelines are ageing. Pipeline specialists today have a focus on and expertise in steel, but there is less certainty in composites as their critical risk factors haven’t faced the same analysis. So, how do you calculate a composite pipeline’s risk profile when a benchmark doesn’t exist?
For context, the chart below shows the total number of composite pipelines that are operating, discontinued, or planned across Western Canada. As you can see, 33% are greater than 15 years of age, with 22% closely following between 10-15 years. Combined, that’s more than 50% of the total number.
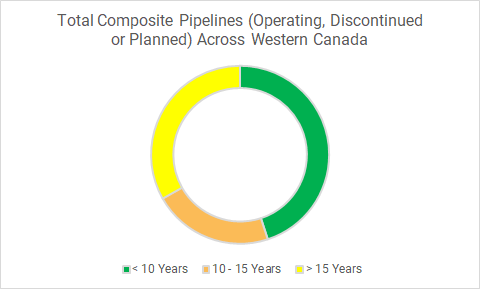
Chart: Data obtained from GDM Converge and GDM Pipeline and Facilities Data.
Further investigation shows that pipeline releases associated with composites are steadily rising. The chart below focuses on Alberta as an example, as the AER is the only regulator that currently fully assigns incidents to a pipeline ID.
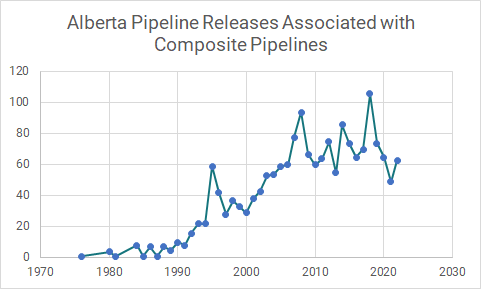
Chart: Alberta pipeline releases associated with composite pipelines. Data obtained from GDM Converge and GDM Pipeline and Facilities Data.
The chart following highlights Alberta’s composite releases by age, of which it is interesting to note that newer pipelines are more likely to cause a release than older ones.
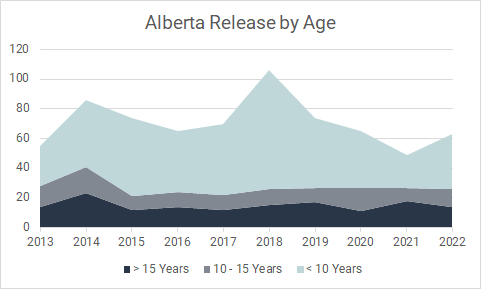
Chart: Alberta releases by age. Data obtained from GDM Converge and GDM Pipeline and Facilities Data.
Our data clearly shows that the upward trend of ageing composites has brought us to a moment in time where accessing a benchmark is critical.
To create a benchmark for Western Canada, GDM partnered with an international oil and gas producer based in Calgary, Alberta to develop one focusing on a new likelihood score to better characterize risk likelihood found in composite pipelines, while providing the flexibility to apply proprietary data to the formula if or when needed.
Historically, GDM offered risk scores with pipelines made of steel, or unknown and undefined metals. The model to determine the risk scores for these metal pipelines uses factors that do not properly characterize risk likelihood for composite pipelines. Therefore, over the course of the last year, GDM consulted with industry experts to focus on what key factors to include to create a trusted and transparent formula, using new risk factors specific for composite pipelines within a multi-factor model.
These factors (including obvious factors like age and material type) are the backbone in calculating an unmitigated likelihood score, referenced as Lnon-metal. In addition to these factors, a further set of new factors were introduced to combine into one mitigated likelihood score referenced as Mnon-metal. Therefore, a mitigated likelihood score would be determined using both the unmitigated likelihood score and the mitigated score, LMnon-metal = Lnon-metal – Mnon-metal.
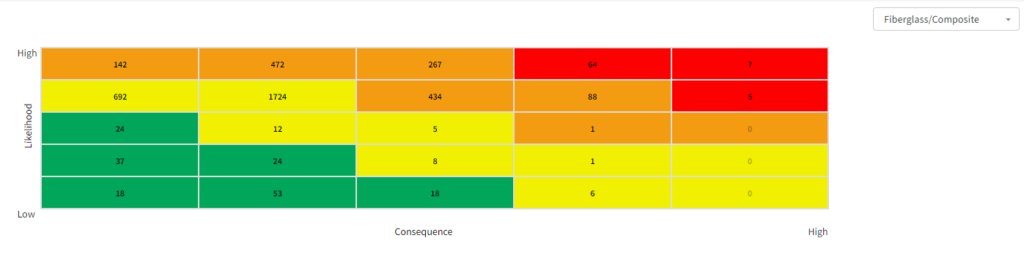
Image: An example of a risk scoring matrix within GDM Converge highlighting the likelihood and consequence of composite pipelines.
By expanding visibility into pipeline materials to include composites, we hope to further prepare producers and the companies that serve them with the information and tools needed to ensure risk profiles are as accurate as possible. Pipeline integrity programs matter, and they are crucial in keeping pipelines healthy while meeting production goals, not only as they age, but from the first day they are brought online.
Ultimately, we want for our clients and the industry what we want for ourselves. The assurance of creating a sound pipeline integrity plan that makes us all sleep better at night.
For more information on composite pipeline risk factors in GDM Converge, contact us.